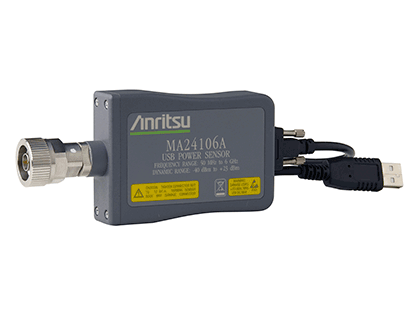
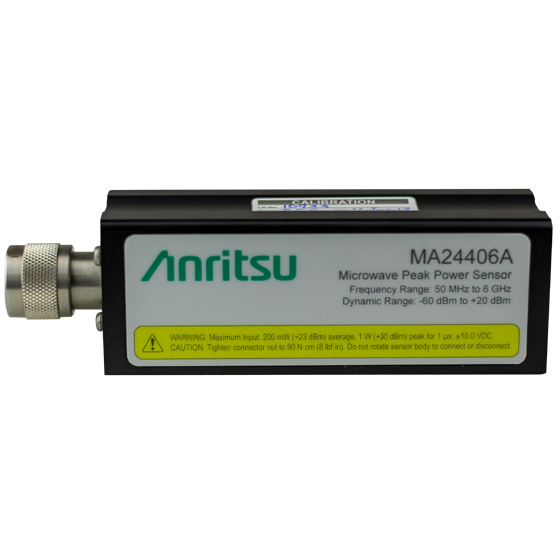
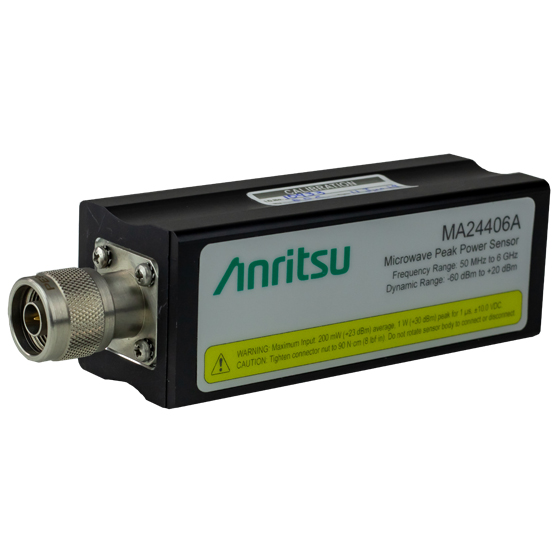
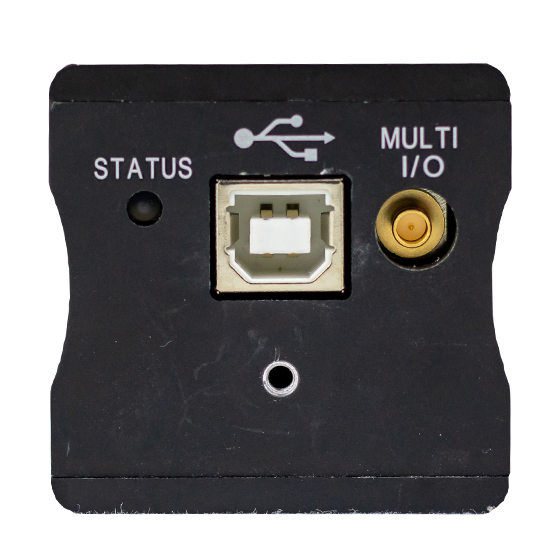
Anritsu USB Peak Power Sensors MA24400A (MA24406A/18A/40A/41A)
See full specification tab below or
At a glance: Key parameters
Meeting the Wireless Communications Challenge of Signal Measurement and Characterisation
- 6 GHz, 8 GHz, 18 GHz, and 40 GHz models
- Up to 195 MHz VBW and 3 ns rise time
- 100,000 measurements per second
- Real-time processing of power readings
- 100 MS/s continuous and 10 GS/s effective sampling rates
- 100 ps time resolution for rising/falling edge measurements
- Full pulse profiling
- Crest factor, CCDF and statistical measurements
The MA24400A USB Peak Power Sensor are designed to meet the challenges of signal measurement and characterization in a complex world of wireless communications. With industry leading rise time and video bandwidth (VBW) of up to 195 MHz (sensor dependent), Anritsu’s USB peak power sensors are able to measure the peak power of wideband modulated signals, like 802.11ac, as well as pulses as narrow as 10 ns.
The MA24400A family also takes measurement speed and resolution to a new level. Other peak power sensors halt measurements while processing captured data. With real time processing of power readings, these sensors never miss a signal. Sampling rates of 100 megasamples per second continuous and 10 gigasamples per second effective provides best-in-class time resolution of 100 ps and the ability to measure 3 ns rise time. This means that even the smallest change in the signal will be caught and plotted for a full picture of signal behavior.
Supplied PC software offers an intuitive user interface to configure and display results. Available displays include simple peak and average power as well as a trace view for pulse power analysis and CCDF graphs.
You may also like